Mapkeep logo

Phase: Stop Self Harm

Principle: Challenge Assumptions

Practice: Spend Control Awareness

Spend Control Awareness

Communication

Motivation

There is little point in focusing on user needs, creating a common language through the use of a map and sharing it transparently in the organization if no-one is willing to challenge it.

Consider these first

Illustrative description

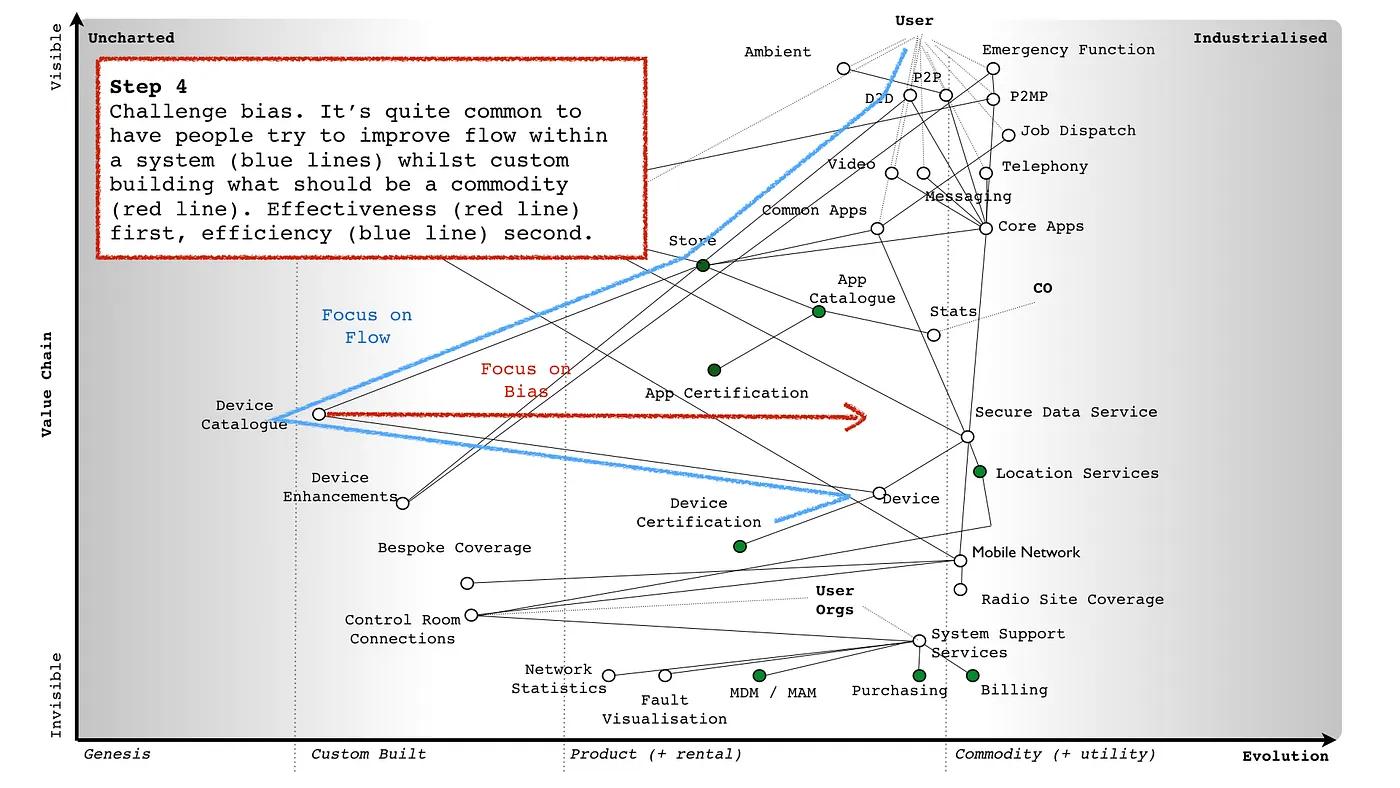
Spend Control does not control the budgets. The purpose of Spend Control is to challenge what we’re doing. Spend Control goes beyond asking about users, needs, and measurement.

Detailed description

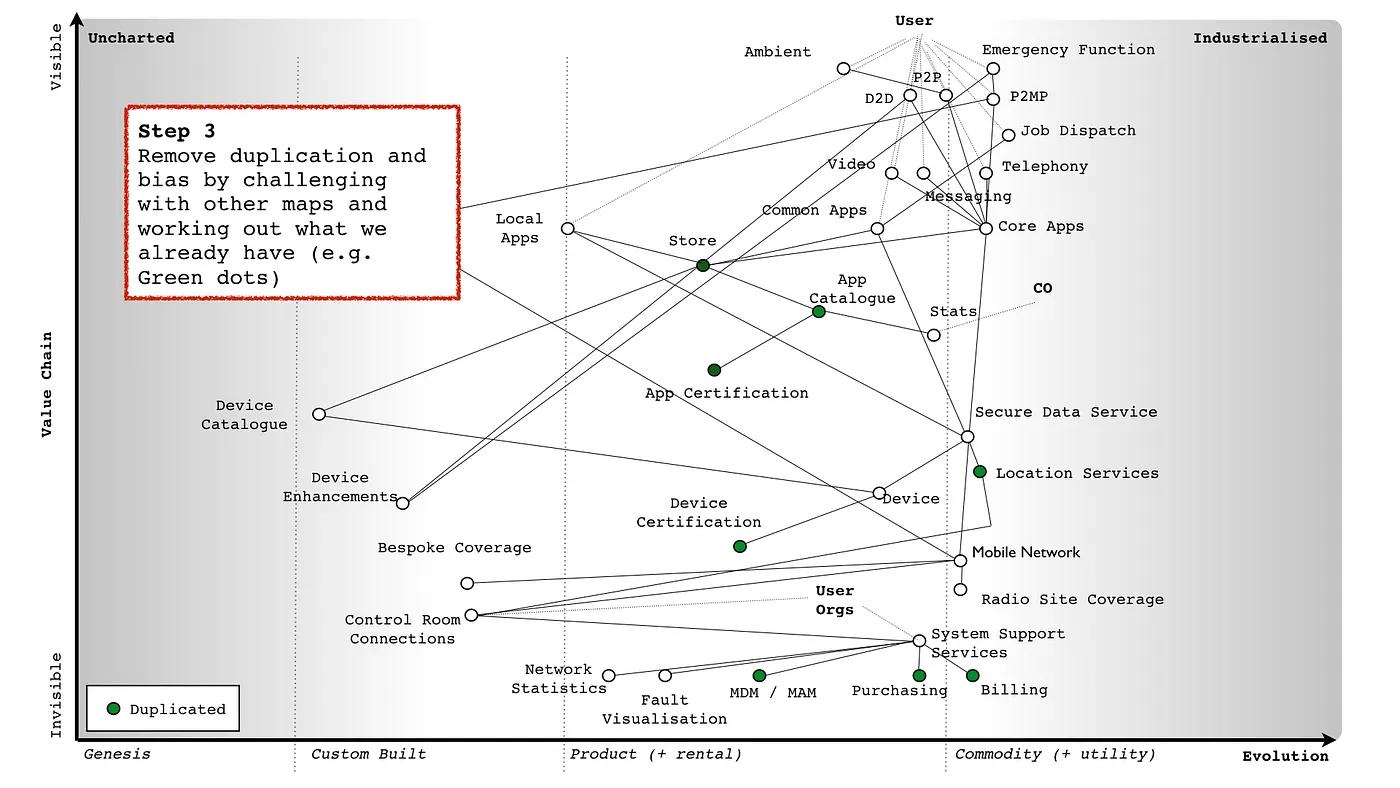
Spend Control does not control the budgets. Few months after Spend Control Introduction, the first thing Spend Control starts to ask for is a map. The point of the map is to challenge beyond users and needs. Spend Control now challenges using maps and doctrine.

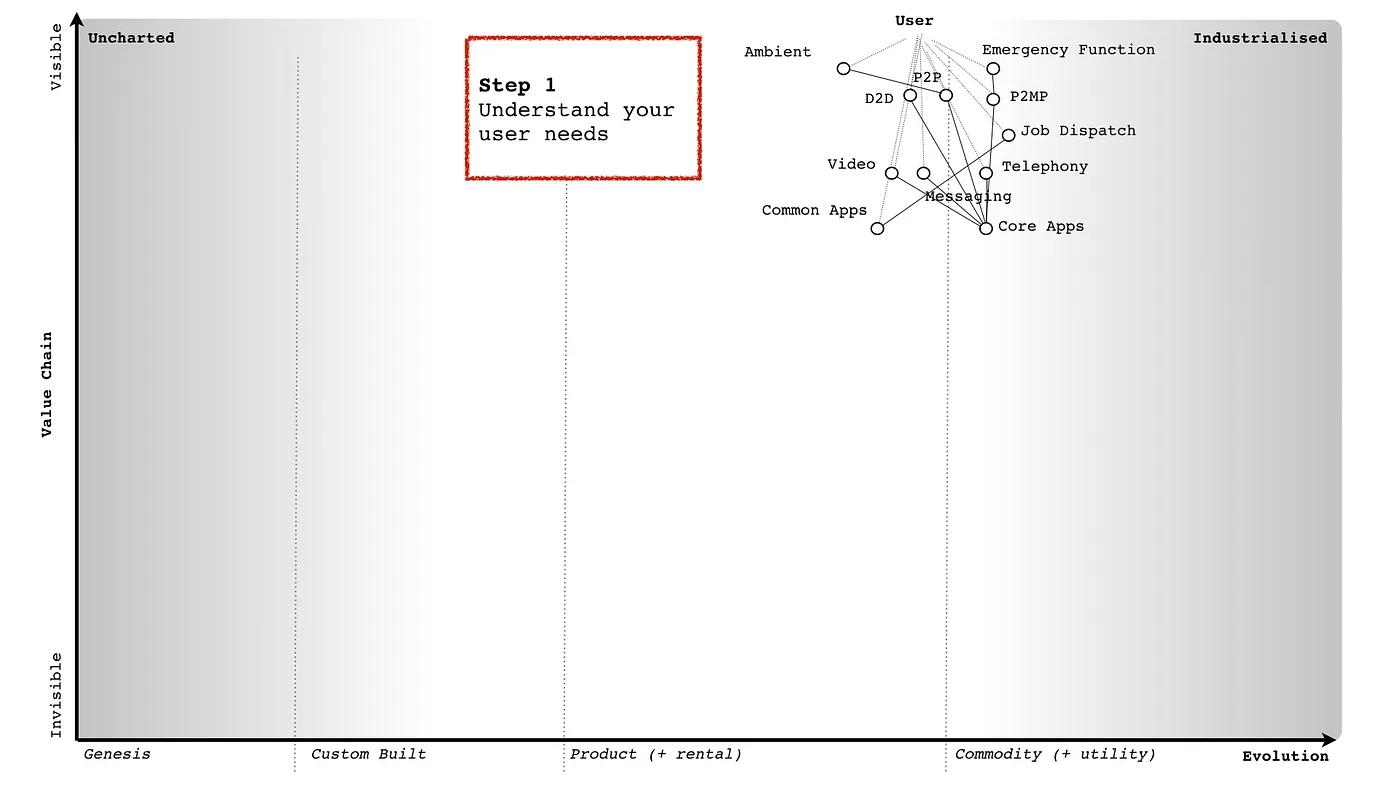
Start with Know Your Users and Focus On User Needs.

Wardley Map highlighting step 1 - understand your user needs - by showing only users and their needs

Know the Details

Wardley Map highlighting step 2 - understand the details i.e. your value chain - by showing a full wardley map and highlighing all the components and everything that goes into fulfilling previously draw user needs

Remove Bias and Duplication

Wardley Map highlighting step 3 - remove duplication - by highlighting duplicate or proposed duplicates of components
Wardley Map highlighting step 4 - challenge bias - by highlighting evolutionary flow in contrast to flow within existing system

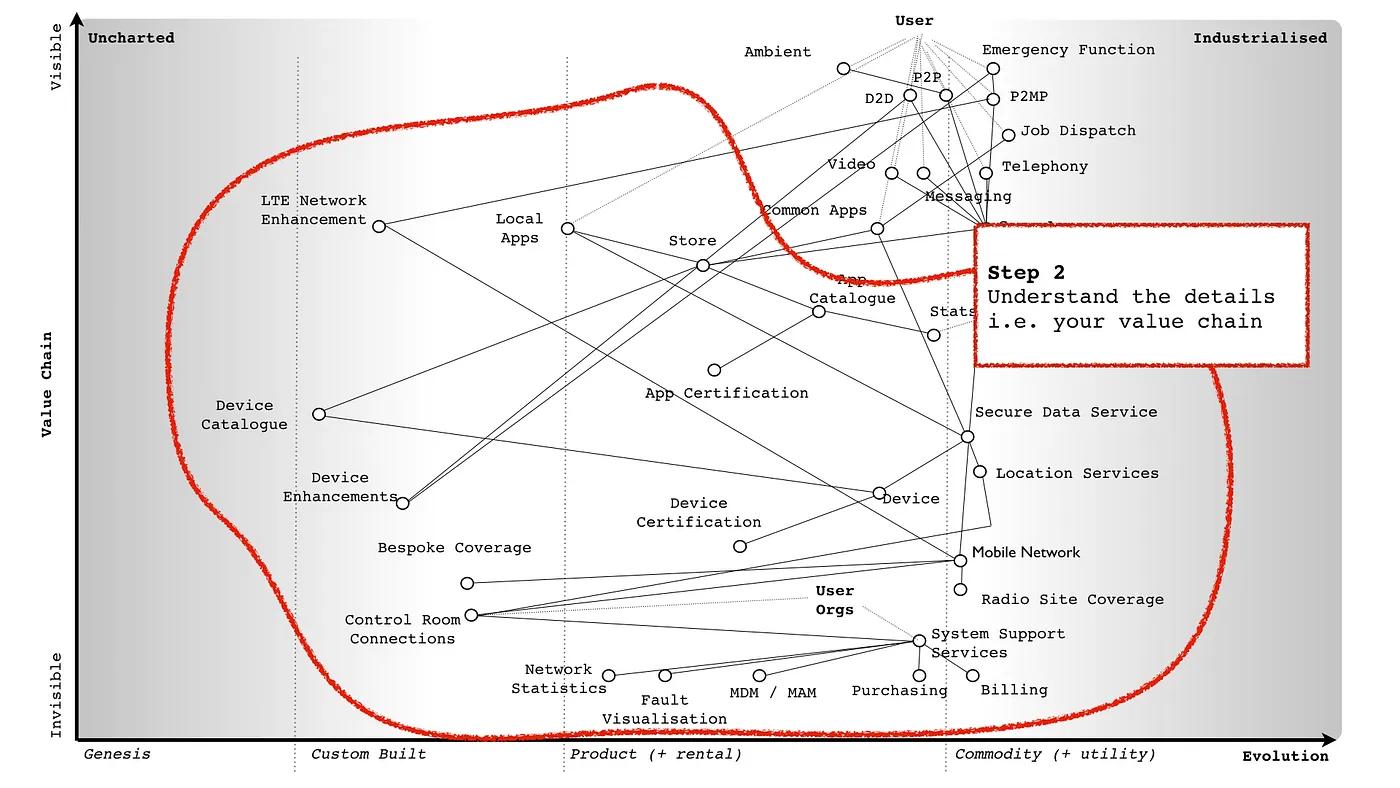
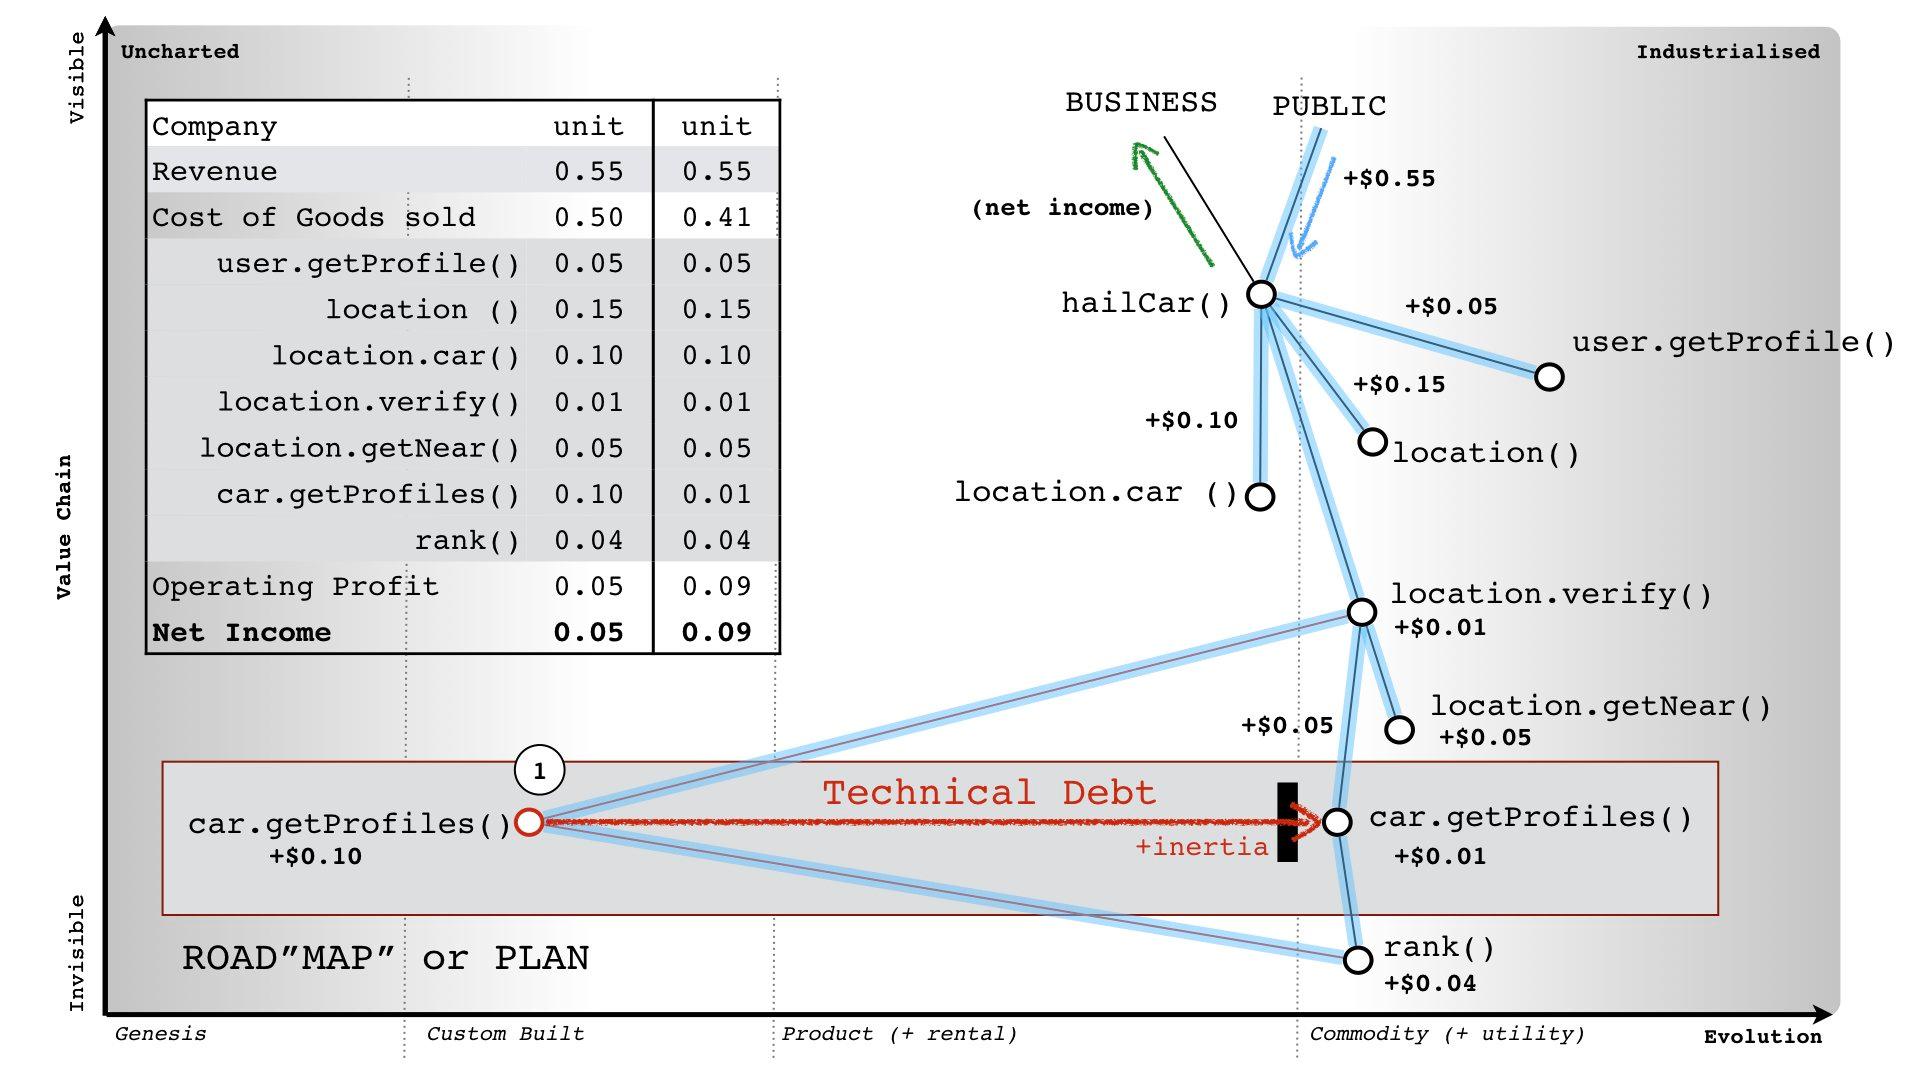
Map and challenge flows of capital. The capital itself can be physical, financial, social, risk, information, etc.

The image presents a strategic mapping graph related to a company's business model with financial data and operational functions. The left side lists company financials, such as Revenue, Cost of Goods Sold, and Net Income, with associated unit costs. Operational functions, like 'user.getProfile()', 'location.verify()', and 'car.getProfiles()', have their costs listed beside them. The graph to the right shows these functions as part of the company's value chain, placed within stages from 'Genesis' to 'Industrialised', indicating the evolution of the business model. Connections imply dependencies or workflows, with arrows pointing from functions to 'hailCar()' indicating a flow or transformation of value. Some functions are connected to financial outcomes, like net income. The concept of 'Technical Debt' is visually represented with a red box, indicating inertia or resistance to change, suggesting an area that may affect the company's progression or costs.

Spend Control builds the view of the landscape you are competing in. All the maps are connected and part of the wider landscape. You are starting to see the landscape and your part of it.

Reminder: Stop reading, take action

Consider next


Adapted from writings by Simon Wardley under CC BY-SA 4.0