Phase: Stop Self Harm
Principle: Remove Bias and Duplication
Remove Bias and Duplication
Development
Motivation
You will often find that there are people custom building what is a commodity. Or they are rebuilding something that exists elsewhere. Remember, they are not doing this because they're daft. They are doing it because of pre-existing inertia. They are doing it due to the lack of any effective communication mechanism. They don't know the thing they're building exists elsewhere.
Consider these first
Illustrative description
Use multiple maps to help you remove duplication and bias within an organization.
Detailed description
Collate maps together to remove duplication and bias. As you collect more maps you start to discover the same component is on many maps. Create a profile diagram by identifying often described components.
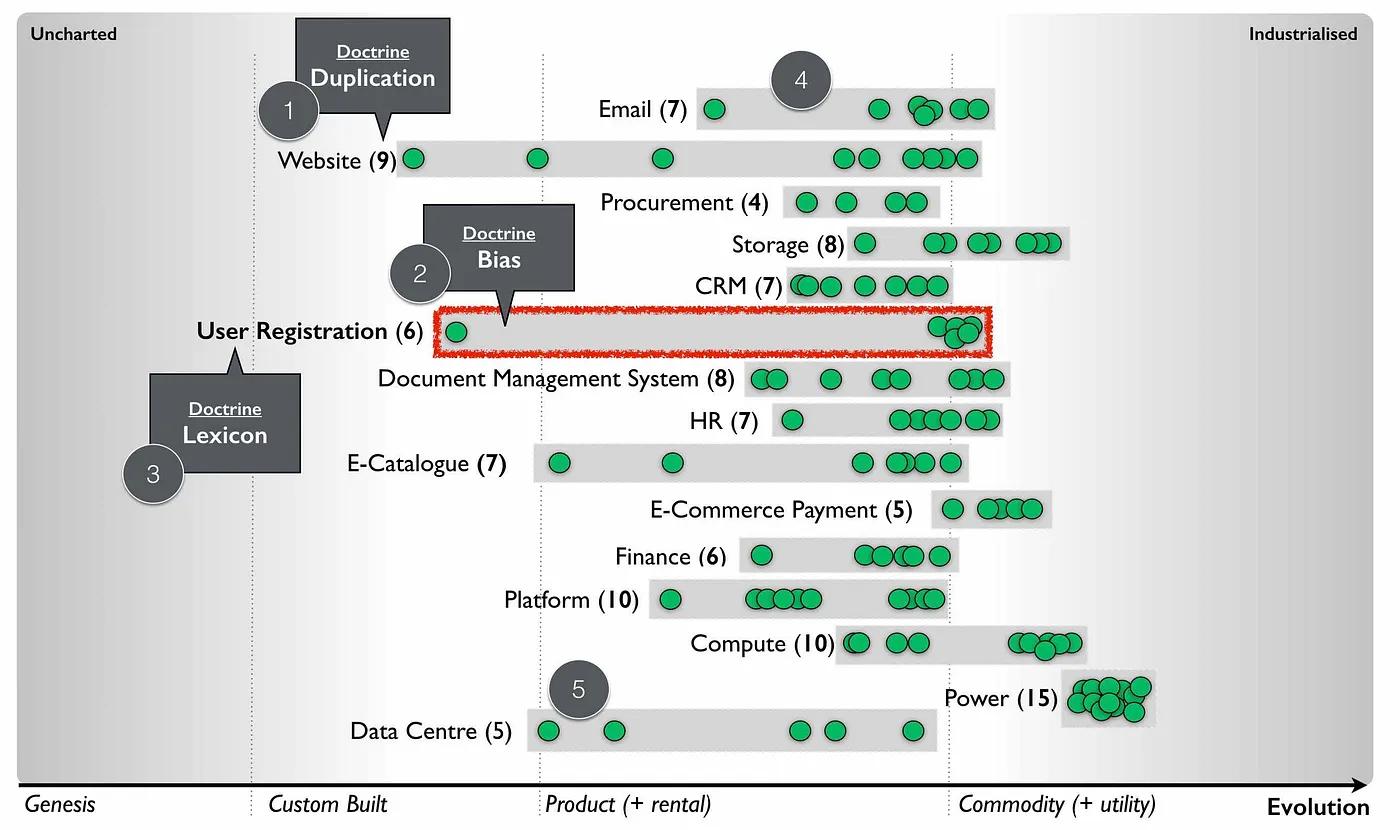
- For each common component you record how many times it repeats. High numbers of repetition is not immediately a problem as there may be a legitimate reason. It could be the same component in different maps. In this example, the maps show nine references to websites.
- The evolutionary stages of components can provide you with an idea of bias. From above, there are six examples of user registration in the maps. One of which is away from the others. This could be because one group thought in their map that user registration was a unique activity (it isn’t). Or, you might have five groups using a common service and one group custom building their own. In this case, they might have a legitimate reason but it’s worth the challenge.
- Collating maps often helps in creating a common lexicon. The same thing is often described with different terms in a single organization.
- There are seven references to email within the maps. Our hope is that (though alas not always the case) this refers to one email system used in different places. There is also some bias. Most groups consider email to be a commodity. One group thinks it is an evolving product. This is worth a challenge.
- There are five references to data centers. Our hope is that this is a couple data centers built for specific geographical reasons.
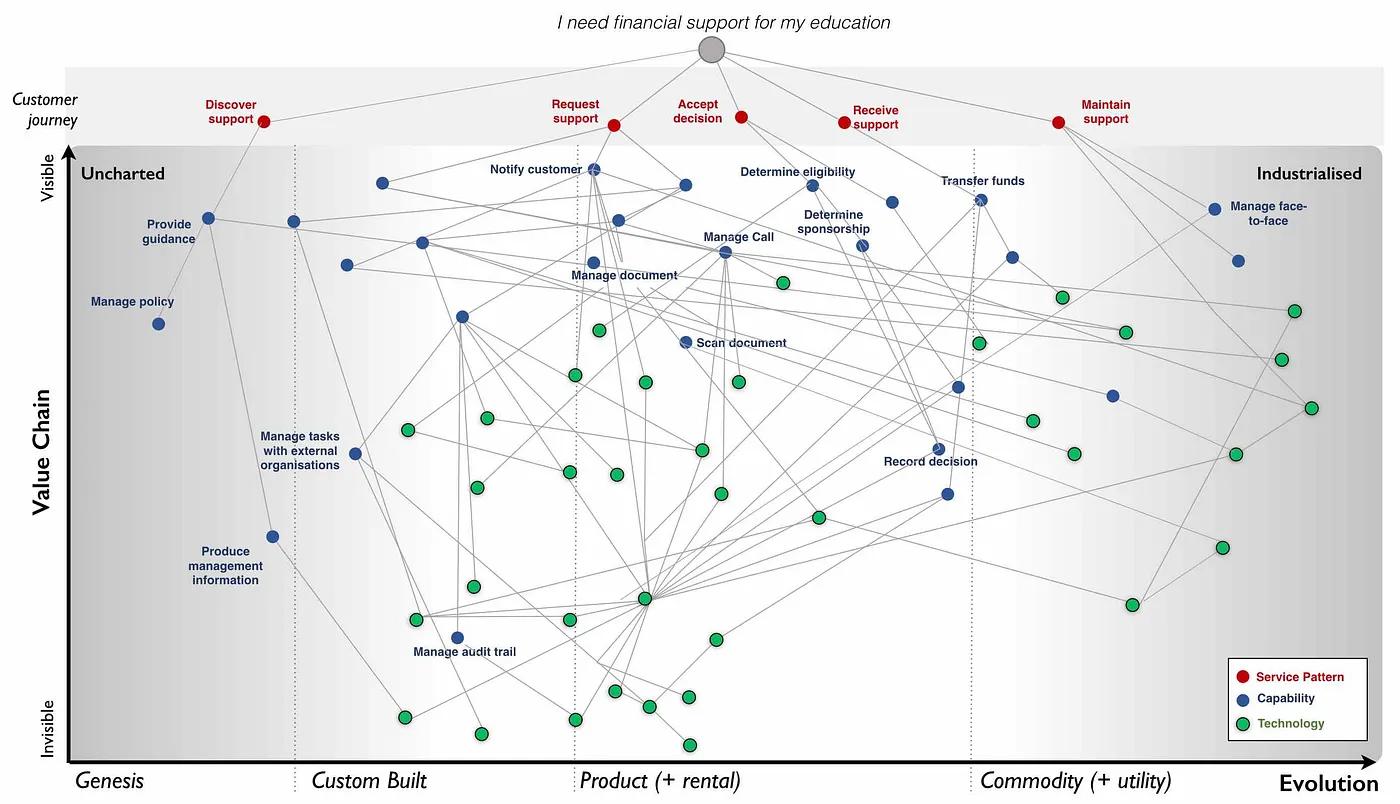
You can also create a profile diagram to determine what capabilities the group needs. An example map highlighting both the customer journey and the associated capabilities:
And the corresponding capability profile:
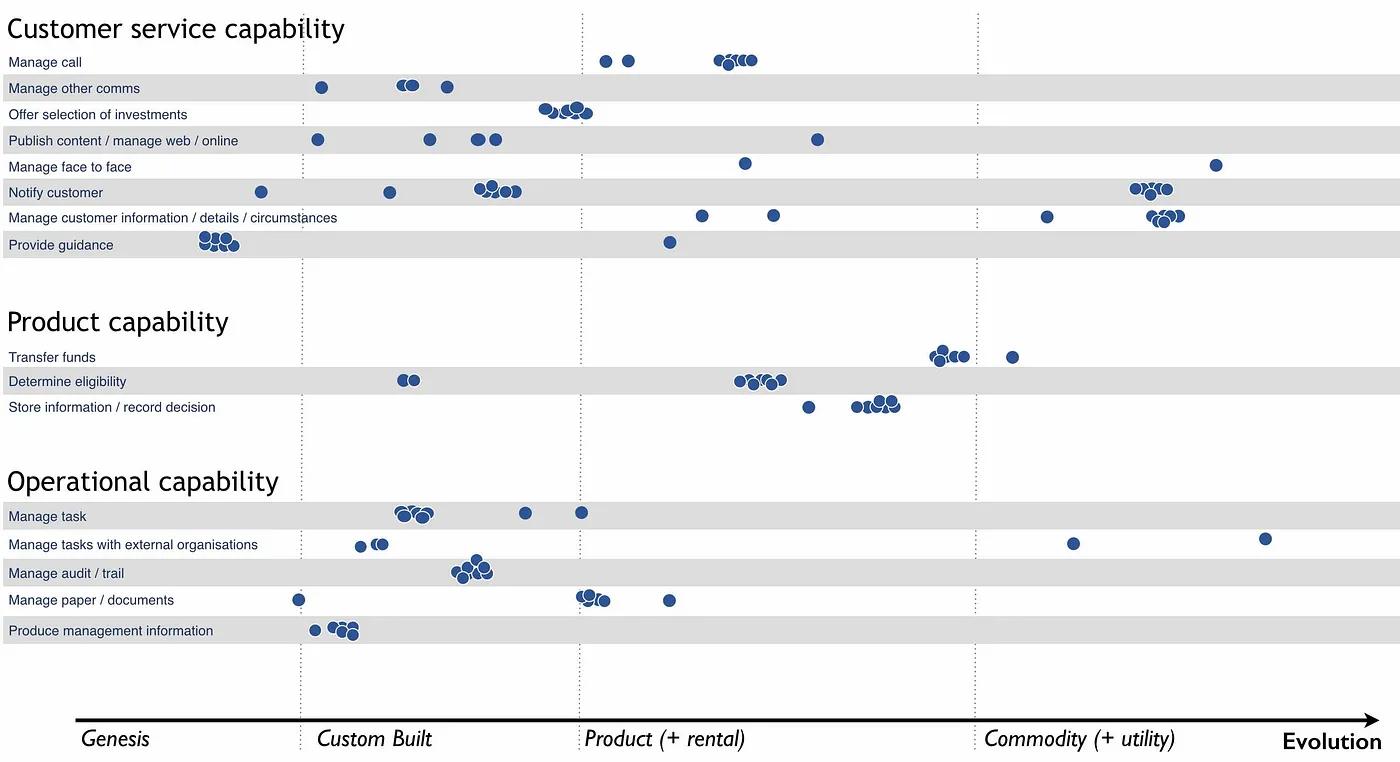
You may find an assumption of capabilities being custom when they should be more defined. You may find duplicated and custom built technology providing a single capability.
Reminder: Stop reading, take action